Course Description

This course provides a basic introduction to the principles, methods, and techniques of empirical social research. Topics will include 1) the fundamentals of the scientific method and scientific inquiry, 2) ethical considerations in research, 3) basic methods of quantitative and qualitative data collection, and 4) strengths and weaknesses of various data collection methods. The course is designed to make students more informed consumers. Through discussion, analysis, and hands-on practice, this course will teach students how to make informed decisions about research findings.

There are no required textbooks for this class!

I have designed this class using Open Educational Resources (OER), meaning that you will be able to access all of the assigned readings for this course without paying anything! There are multiple OER resources used during this course. All readings are provided on Canvas as PDF files that you can download, print, and/or read online.

This course uses chapter(s) from the following OER textbooks:

Photograph of textbooks

Helpful Resources

Below is a collection of carefully curated resources designed to support and enhance your understanding of the various concepts covered in your methods course. Whether you are looking for supplementary readings, instructional videos, or detailed explanations, these resources are here to help you succeed. 

John Oliver’s segment on Scientific Studies is a humorous examination of very important concerns relating to the replication, reliability, and understanding of scientific research.

Peer-reviewed research articles can be challenging to read, particularly if you take the wrong approach to reviewing the article. This video describes how to review a journal article by focusing on the most relevant and important areas first, and then moving to more specific detail as needed.

A series of high profile, unethical research studies led to the institution of Institutional Review Boards (IRB). The role of the IRB is to oversee all research that uses human subjects. The materials below include documentaries of the more infamous research studies as well as information and links to UT Tyler IRB materials.

The Stanford Prison Experiment is one of the classic examples of unethical social science research due to the psychological harm inflicted on its participants. You can read more about the experiment at the website: https://www.prisonexp.org/

The Milgram Experiment is one of the classic examples of unethical social science research due to the psychological harm inflicted on its participants. The Milgram experiment has been duplicated several times, but this video is the original study.

The video provided here is called Miss Evers Boys; Miss Evers Boys is a historical fiction movie about the Tuskegee Syphilis Study, told from the viewpoint of one of the nurses working in the study.

The Tuskeegee Syphilis study was a medical research study on the progression of syphilis in black males. This study was one of the unethical research studies that led to the creation of Institutional Review Boards to protect human subjects.

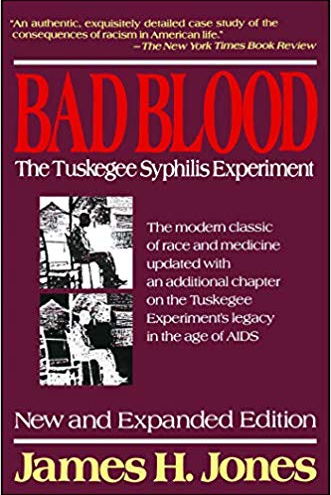
If you are interested in learning more about this study, there is a nonfiction book called Bad Blood: The Tuskeegee Syphillis Experiment that describes the experiment from beginning to end.

In class, you learn about the problem of predatory journals that use the model of Pay to Publish rather than publishing articles based on the quality of the research content itself. Several hoax papers have been submitted to predatory journals to see if they can be published. One example of this is provided below. The “journal article,” written by Gerry Louis, was submitted and accepted to a predatory journal in 2018. The article has a scientific sounding title, but is actually a made up study that attempts to identify differences in bottom-wiping technique based on political orientation. Below is the published article itself as well as a newspaper article written by Louis describing his experience.

One of the most challenges parts of research methods is the operationalization process. Defining concepts is a process that sounds deceivingly easy. The problems is that we often take for granted that other people understand what we mean when we talk about a concept, even though the concept itself is subjective and everyone may picture it a little differently. I have created two videos for you to help you with this process. The first video will help you turn a vague concept into a well-defined real-world measurement. The second video shows you how to determine the level of measurement of a question using a flow chart decision process.

Below are other YouTube videos that can help you with the operationalization process. The first two videos will help you identify and operationalize the independent and dependent variable (IV & DV) from a hypothesis. The second focus on levels of measurement. You can also find more information about IV & DVs on the Department of Health and Human Services website.

The videos below relate to the experimental design process. I have created a video that explains the design maps for experimental designs we discuss in class. I also cover the threats to validity and how those relate to the experimental designs. I have also provided you with additional videos on those concepts if you would like more information about experimental designs and/or internal validity.

The videos below discuss sampling methodologies and how to obtain participants for a research study.

An important component of sampling procedure are the unit of analyses. The videos below explain what a unit of analysis is and a common logical fallacy known as the ecological fallacy. The ecological fallacy occurs when our unit of analysis does not correspond with the conclusions we are generating from our study.

The videos below will help you design clear and reliable survey questions and questionnaires. The videos on the left provide examples of badly worded questions and describe how to create good survey questions.

The video below describes common reliability issues in survey research and explains how to check your surveys to ensure they are reliable.

This set of videos describes how to use Qualtrics to create a survey and gather responses. QualtricsXM is an online survey distribution system. UT Tyler has a campus license so access is free for all students. Student users must have their access approved by the Office of Assessment and Institutional Effectiveness before they are allowed to distribute surveys.

This set of videos describes how to use Qualtrics to create a survey and gather responses. QualtricsXM is an online survey distribution system. UT Tyler has a campus license so access is free for all students. Student users must have their access approved by the Office of Assessment and Institutional Effectiveness before they are allowed to distribute surveys.

In my class, you will learn to use basic univariate and bivariate statistical techniques to analyze data. If you have not completed a statistics course recently (or ever), it may be helpful for you to learn about data analysis in more depth. The button below takes to you an open access e-textbook on statistics. This e-textbook includes written summaries as well as videos and practice exercises on a variety of statistic topics that we will discuss. Use of this text is not required for the course, but this is a good resource for additional help.

In this video, I show you how to calculate the mean, median, and mode of a ratio-level variable dataset.

In this video, I show you how to calculate the range, variance, and standard deviation of a ratio-level variable dataset.

Here are some other resources for understanding statistical calculations for this course.

When constructing graphs and charts, it is important to consider the best method of construction to help communicate your findings easily and quickly to the reader. The University of Leicester’s has a guide for the presentation of numerical data. Mentioned in that guide are supplemental guides that cover bar charts, histograms, and pie charts more specifically. All four of those guides are provided below. I have also provided you with YouTube videos that explain how to create charts and graphs in Microsoft Excel.

Survey Research Project – How To

One of the most common research projects in our Research Methods course is the online survey research project. To guide you through this process, I have created a series of instructional videos and compiled relevant resources. These materials will walk you through each step, from selecting your project topic to constructing your survey, coding responses, analyzing data, and presenting your findings.

The first step of your survey research project is to select a research topic. You can choose any topic you want, but it must be something that is reasonable given your target audience (classmates, friends, and/or family) and appropriate for the course.

  • To help you brainstorm topics, here are some of the research questions students have done in previous semesters:
  • Are there gender differences in campus carry attitudes?
  • Are Criminal Justice majors more knowledgeable about wrongful convictions than non-Criminal Justice majors?
  • What is the impact of a Public Service Announcement video on perceptions of drinking and driving?
  • What is the impact of empirical research findings on attitudes towards sex offenders?
  • Do UT Tyler employees have different rape myth acceptance beliefs compared to UT Tyler students?
  • Does ethnicity impact perceptions of the United States government?

Will we need to get IRB approval for our study?

When research is being used for classroom purposes only, it usually falls under the classroom exemption policy and does not require review by the UT Tyler Institutional Review Board. However, the classroom exemption policy does not apply to all proposals. Topics deemed to be more than minimum risk require review by the UT Tyler IRB.

To the left is the UT Tyler IRB Classroom Exemption Policy, which outlines the topics and design designs that would require IRB review even when the research study is completed as a class project only.

In this video I show you an example survey that I created in Google Docs. This survey includes the informed consent form you will be using in your surveys, skip and fill questions, check all that apply questions, and open-ended response questions. You can download a copy of the survey instrument in this section as well.

In this video I show you how to set up a Google Forms survey using the example survey I created in Google Docs. This video also shows you how to preview your survey to see how questions are displayed and to check for any question flow problems.

Here is the link for the Google Forms survey (click here). This link allows you to see the collaborator view. Please do not make changes to this survey so as to ensure that it is available and consistent for all students who access it.

In this video I show you how to stop data collection and review the data collected in Google Forms. I also show you how to download your survey responses into Google Sheets so that you can begin data analysis.

In this video I show you how to code your survey data in Google Sheets using a survey codebook. In my courses, codebooks must include the following:

  • Variable name [All caps, one word only]
  • Question text
  • All possible responses
  • Numerical values for each response option
  • Numerical values for missing data (use a period for easy analysis)

You can use any statistical analysis software program you prefer to analyze your survey data. I have created how-to videos for four different statistical programs and provided them below. In each video, I upload the coded spreadsheet into the program and then show you to how to run descriptive statistics, create frequency tables and bivariate tables, and create pie graphs and bar charts.

This video shows you how to analyze your data in JASP, an open-source, free software program that can be downloaded onto your personal computer. Coding Note: In order for JASP to recognize missing data, you must use a period as the missing data value.

This video shows you how to analyze your data in Jamovi, another open-source, free software program that is downloadable onto your personal computer. Coding Note: In order for Jamovi to recognize missing data, you must use a period as the missing data value and set the Data Type to Integer (under Data Setup menu).

This video shows you how to analyze your data in SPSS, which is a commonly used statistical program. SPSS is not free, but UT Tyler has a campus license so you can access it for free in the computer labs on campus or by using the UT Tyler remote desktop. You can also rent a student license of SPSS for your personal computer for about $50 a semester. Coding Note: In order for SPSS to automatically recognize missing data, you must leave all missing data values blank.

This video shows you how to analyze your data in Miscrosoft Excel. While Excel is not designed as a statistical analysis program, you will be able to use the formulas in Excel to run the basic data analysis required for this project. Coding Note: In order to avoid Excel automatically including missing data in the analysis, you must leave all missing data values blank or use a period as a missing data value.

The final step of a research presentation is the presentation of your findings. Poster presentations are a common way that researchers disseminate important findings from their research studies. Research posters require careful, thoughtful design and preparation because they require a lot of information to be presented in a small space. The resources provided here are designed to help you create your research presentation. The University of Texas at Austin also has a great Guide to Creating Research Posters with samples, templates, and design considerations.

Undergraduate Student Projects

2019 UT Tyler Lyceum Student Research Showcase

Several Research Methods students participated in the 2019 Lyceum. These students designed their own survey research projects on a topic of their choice, then collected and analyzed their data. They all worked really hard, and I’m very proud of their accomplishments!

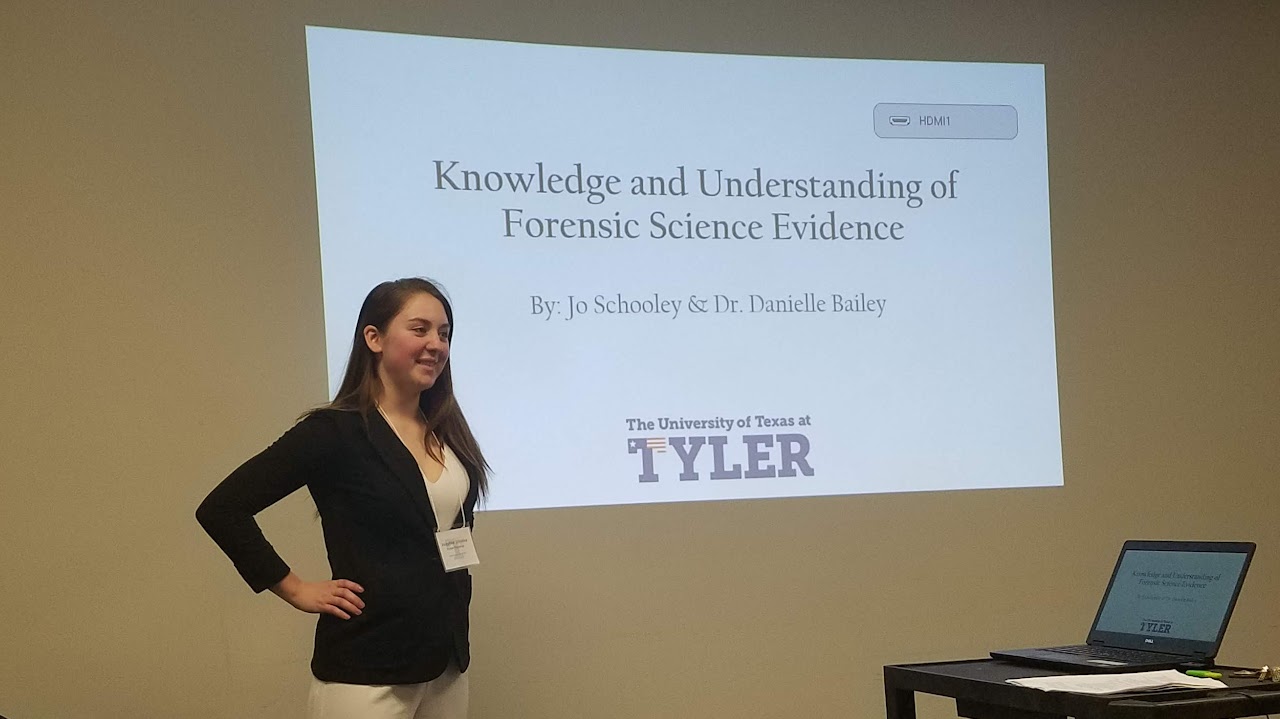
Oral Presentation by Jo Schooley

Criminal justice professionals, including lawyers, judges, and police officers, are essential parts of the justice system. Due to their role in evidence collection, processing, and testimony, their ability to interpret and understand forensic science evidence is significant to the outcome of a person’s future. The goal of this study is to determine whether these professionals have the scientific training and interest in forensic science that allows them to interpret forensic evidence findings. This information will be compared to a sample of college students, who may have a better comprehension of forensic science methods and/or limitations due to having a more recent science education.

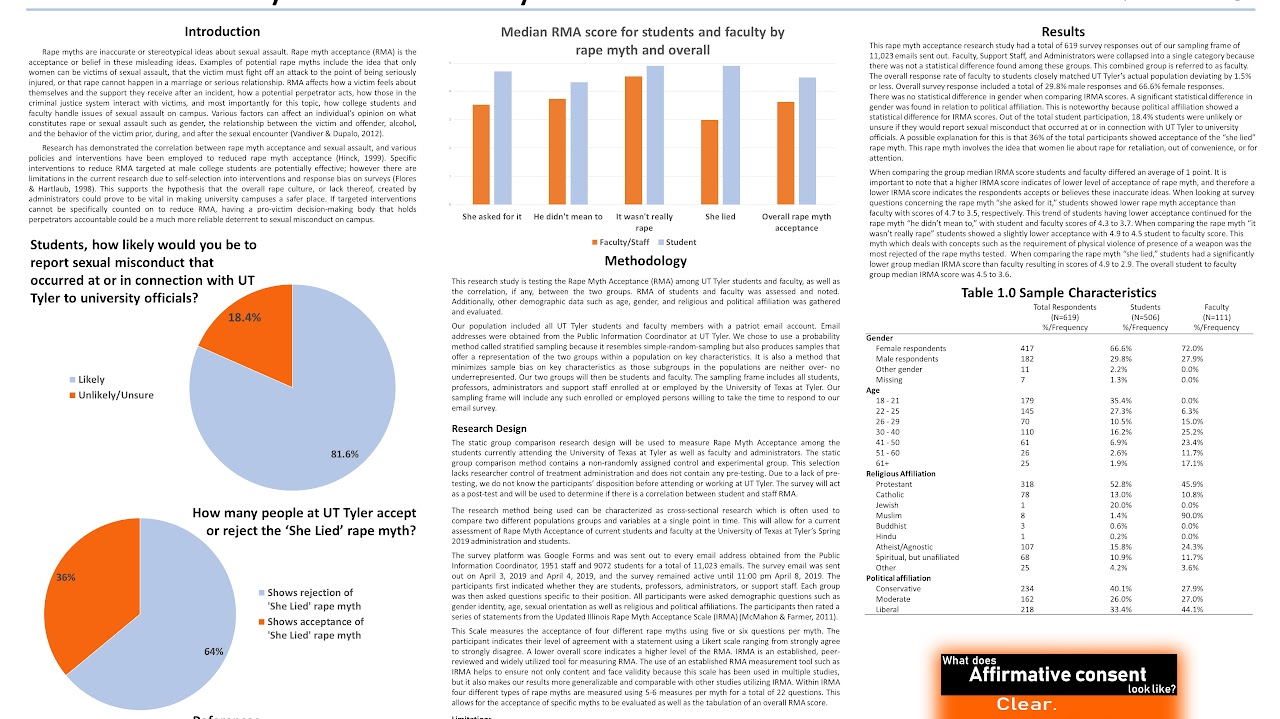
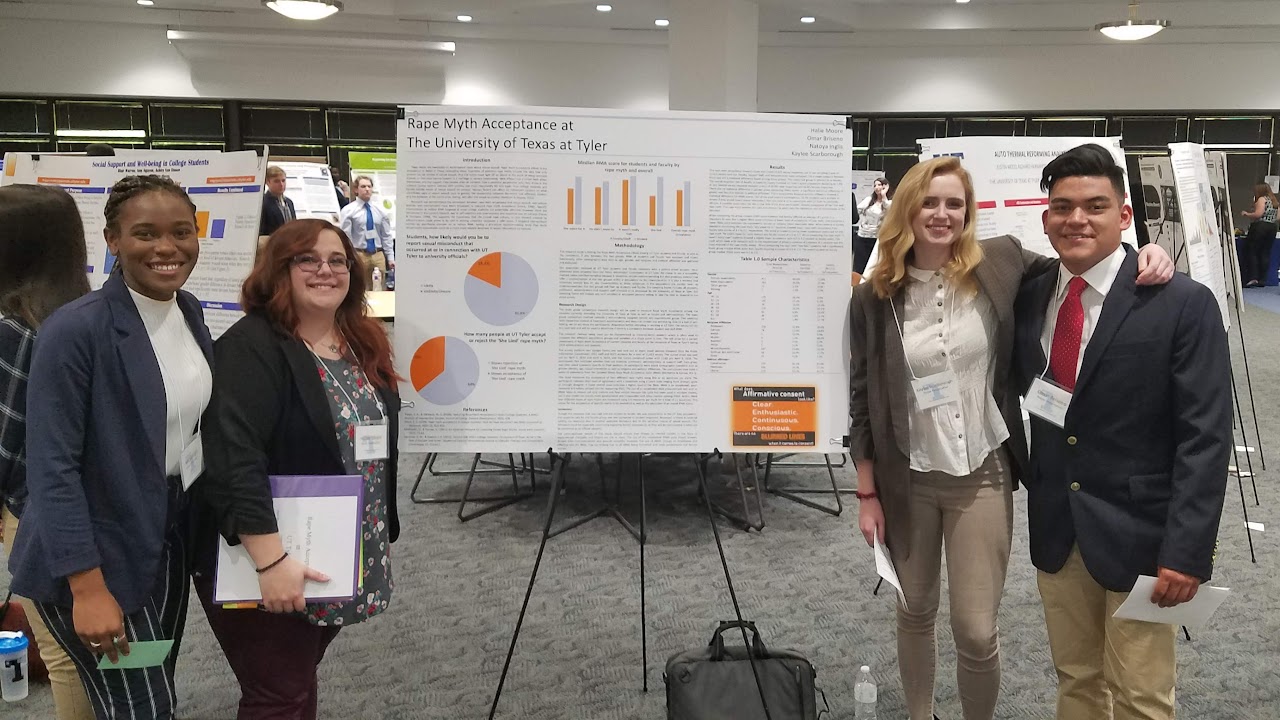
Poster Presentation by Halie Moore, Omar Briseno, Natoya Inglis, & Kaylee Scarborough

This study will research rape myth acceptance at UT Tyler. Rape myths are inaccurate or stereotypical ideas about sexual assault. Rape myth acceptance is the acceptance or belief in these misleading ideas. To measure rape myth acceptance at UT Tyler, we would like to conduct a survey of students and administrators, especially those in policy and decision-making capacities, to note rape myth acceptance among these groups as individuals, as well as to compare the findings between the two groups. We will be using a probability sampling method called stratified sampling. For this approach, we will first divide up the sampling frame into two mutually exclusive and exhaustive subgroups, chosen at random, allowing us to study both groups as well as the overarching population. The research would provide insight into the rape culture, or lack thereof, at UT Tyler. Having contrasting data from students and administrators could provide valuable insight into the potential of campus policy to influence rape myth acceptance on a college campus.

Poster Presentation by Katarina Stadelmann, Bridgette Hairgrove, Raylynn Henry, & Luis Ortiz, Jessica Ross

This research study is designed to determine if there could be any relationship between gender and opinions on marijuana legalization in a sample of college students. The survey created for this research was distributed via social media and announcements on Canvas to college students in the Tyler, Texas area. The significance of this study is the impact it could have on the political aspects of marijuana legalization. Could gender be related to a person’s opinion on marijuana? Furthermore, could gender affect how people vote on marijuana legalization? These are some of the questions being addressed in this study.

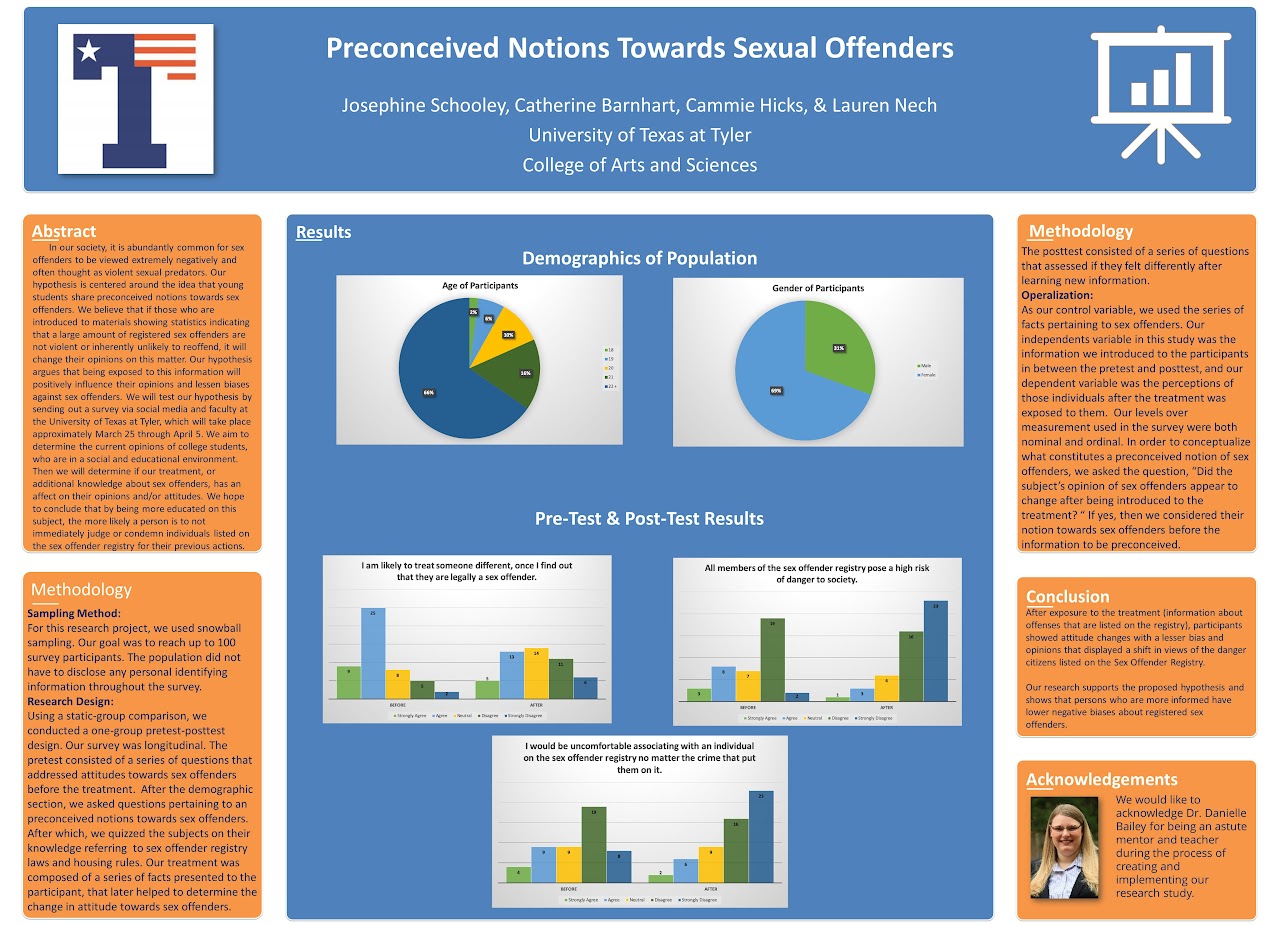
Poster Presentation by Josephine Schooley, Cammie Hicks, Lauren Nech, & Catherine Barnhart

Our hypothesis is centered around the idea that young students share preconceived notions towards sex offenders. We believe that if those who are introduced to materials showing statistics indicating that a large amount of registered sex offenders are not violent or inherently unlikely to reoffend, it will change their opinions on this matter. Our hypothesis argues that being exposed to this information will positively influence their opinions and lessen biases against sex offenders. We will test our hypothesis by sending out a survey via social media and faculty at the University of Texas at Tyler, which will take place approximately March 25 through April 5. We aim to determine the current opinions of college students, who are in a social and educational environment. Then we will determine if our treatment, or additional knowledge about sex offenders, has an affect on opinions and/or attitudes.

Graduate Student Projects

During the Fall 2019 Graduate Research Methods course (CRIJ 5396 & PADM 5396), students had to design a survey research project of their own and create a policy brief and presentation video highlighting their results. Both assignments were designed to be shown to the relevant policymakers, so they were short and were written in non-technical language so as to be accessible to all persons, including those unfamiliar with the subject area. The materials below are some of the final products created by students in that course.